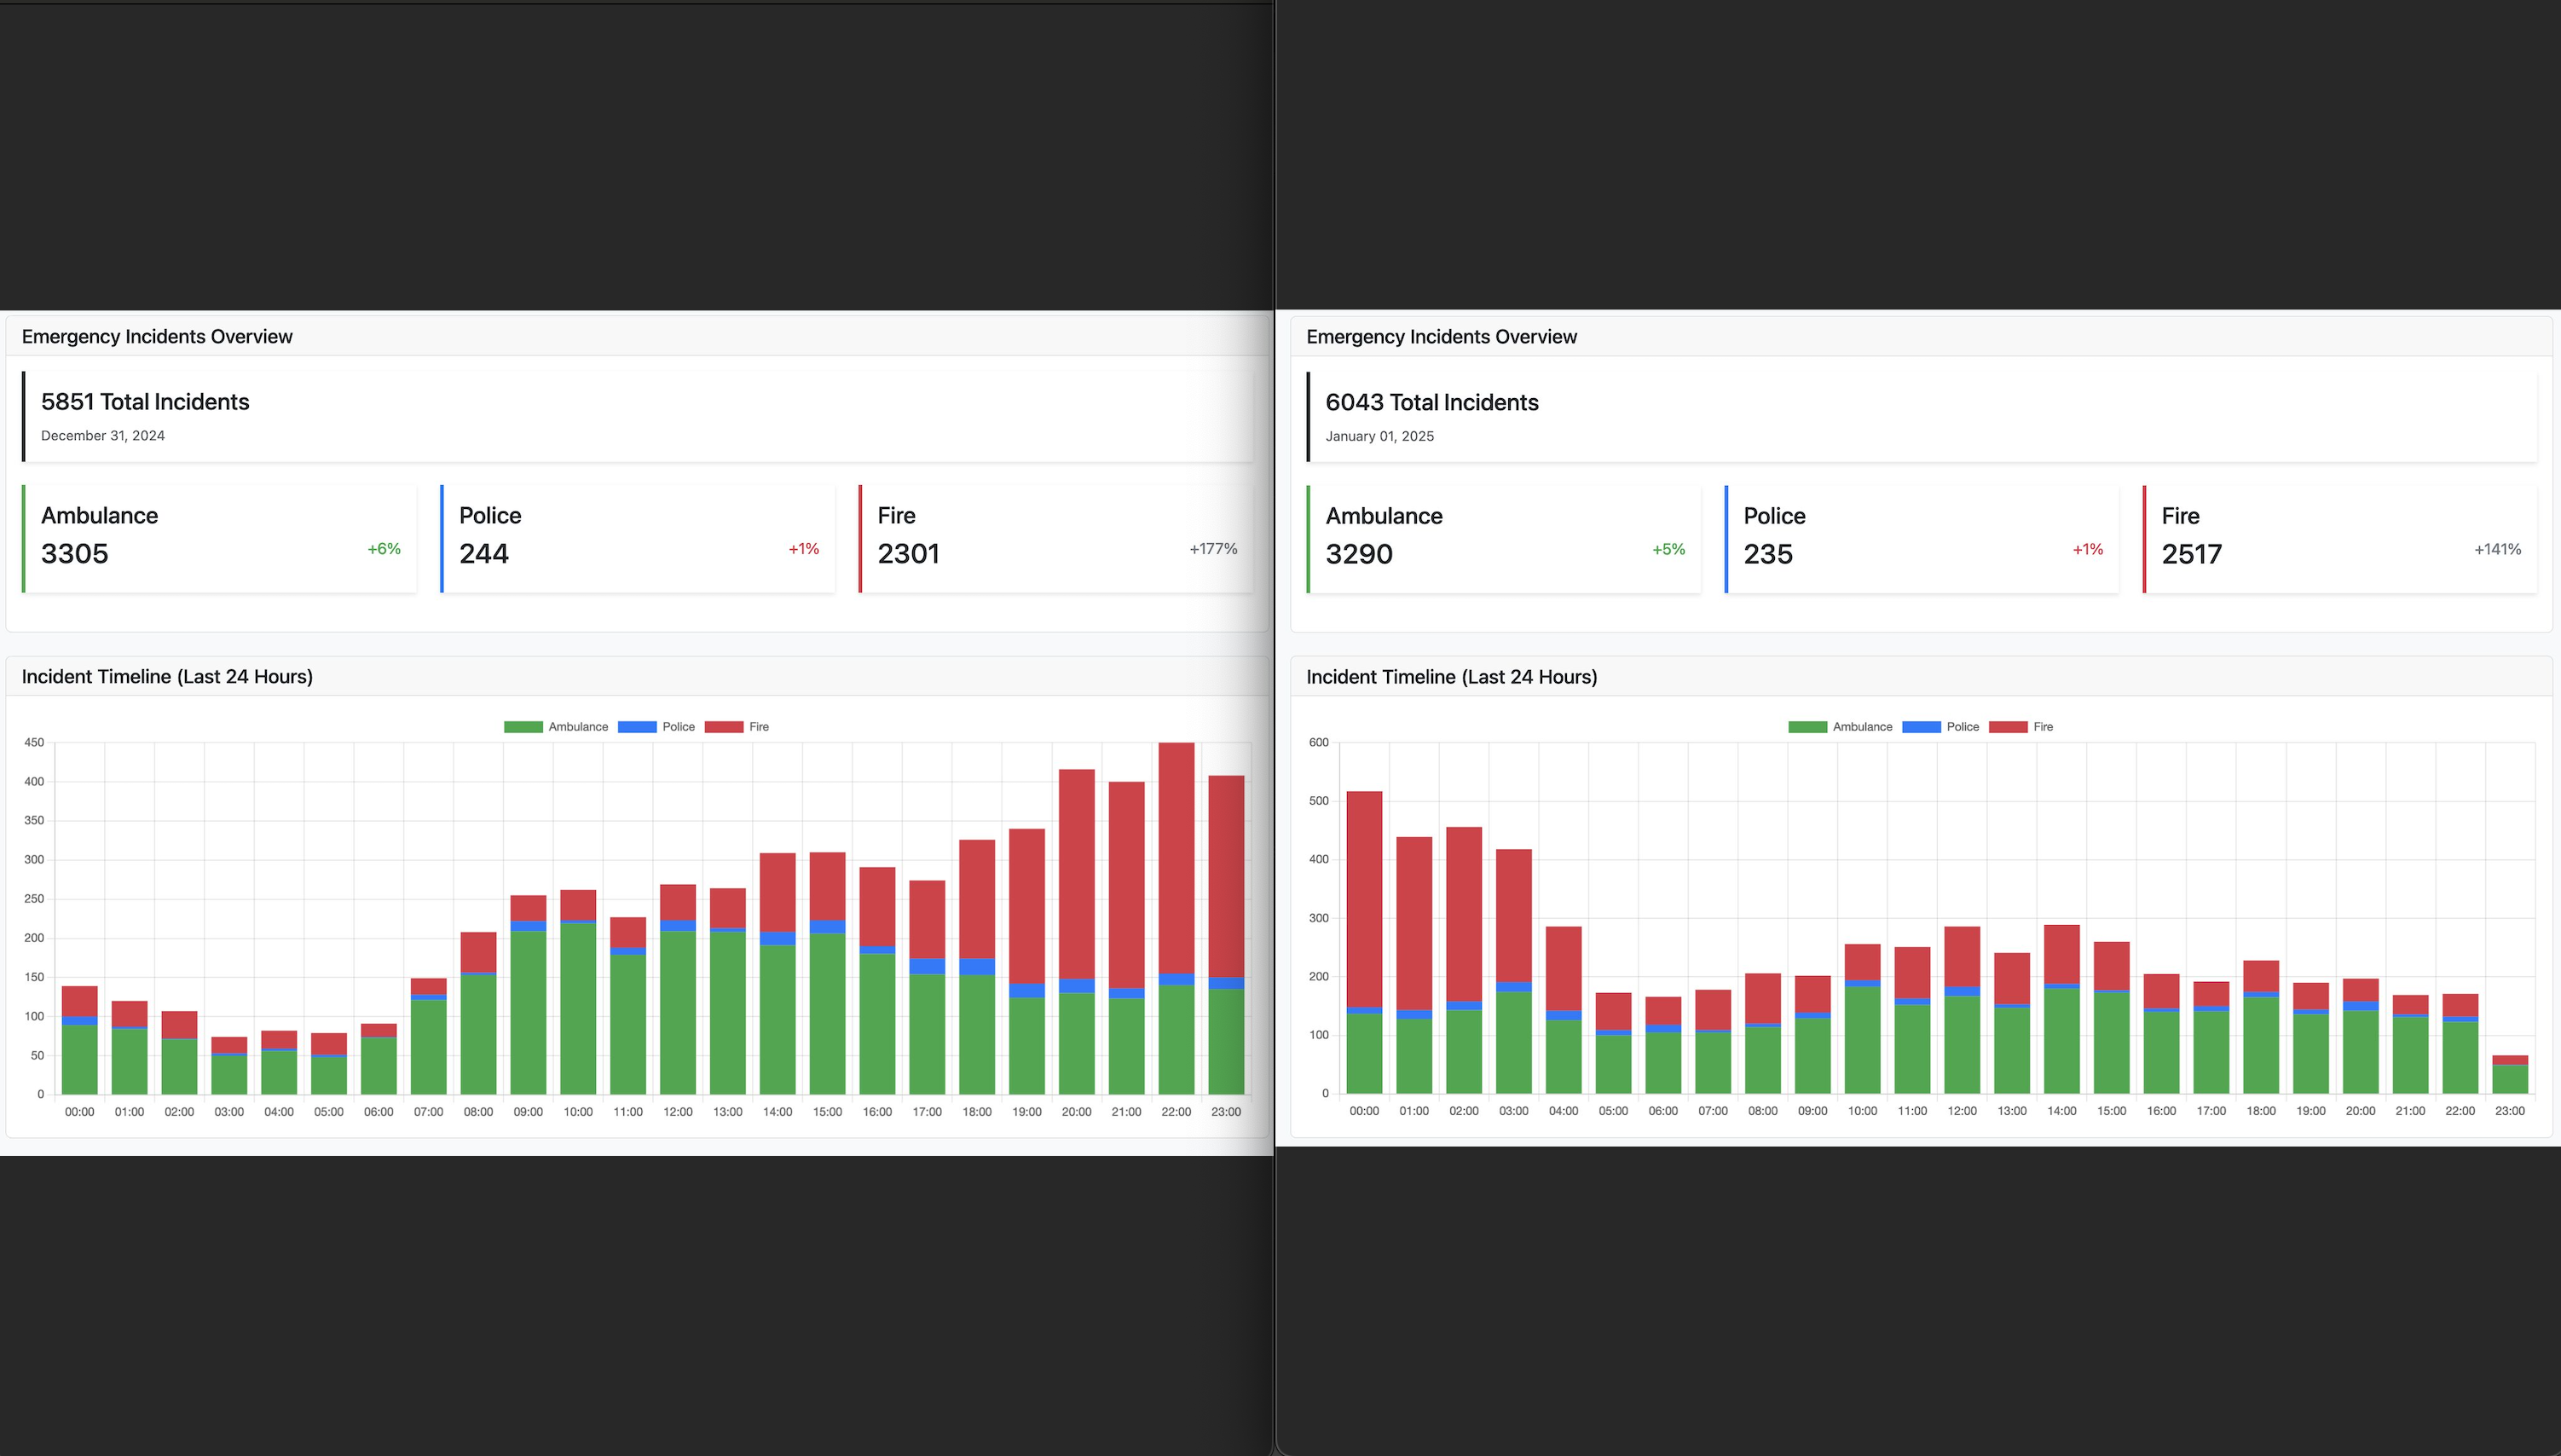
The Dutch fire department has been busy on 31th December!
A few months ago, I and my neighbour Bauke Bakker saw a police helicopter flying to an incident nearby. Bauke checked his phone and mentioned that someone has unfortunately been drowned.
When I asked how he figured it out, he showed me p2000-online which lists the emergency reports of Politie Nederland, Brandweer and Ambulance across the Netherlands.
I got curious and a few weeks ago I build an analysis dashboard on it using an AI agent (link in comments).
One interesting insight I noticed today was how the number of fire reports took over on 31th of December. Looking at the chart, the proportion of reports across different emergency services is completely reversed.
Overall the number of reports on the last day of the year is higher than other days. But while the fire reports are usually 25% of the daily reports, on the new year’s eve, the fire reports increase steadily until one hour after midnight to peak above 500 reports and then starts to fall again.
While it is intuitive that this happens due to the fireworks, its interesting to observe it on real-time data as well.
You can check it out at emergencynl.nasir.sh.
